
Phoenix CollegeDepartment of Microscopy Contact Dr. Ong
METHODS & MEASUREMENT

Start with the
question.

Each instrument translates a different interaction into evidence. Compare what the signal reveals, what the specimen demands, and where interpretation can go wrong.

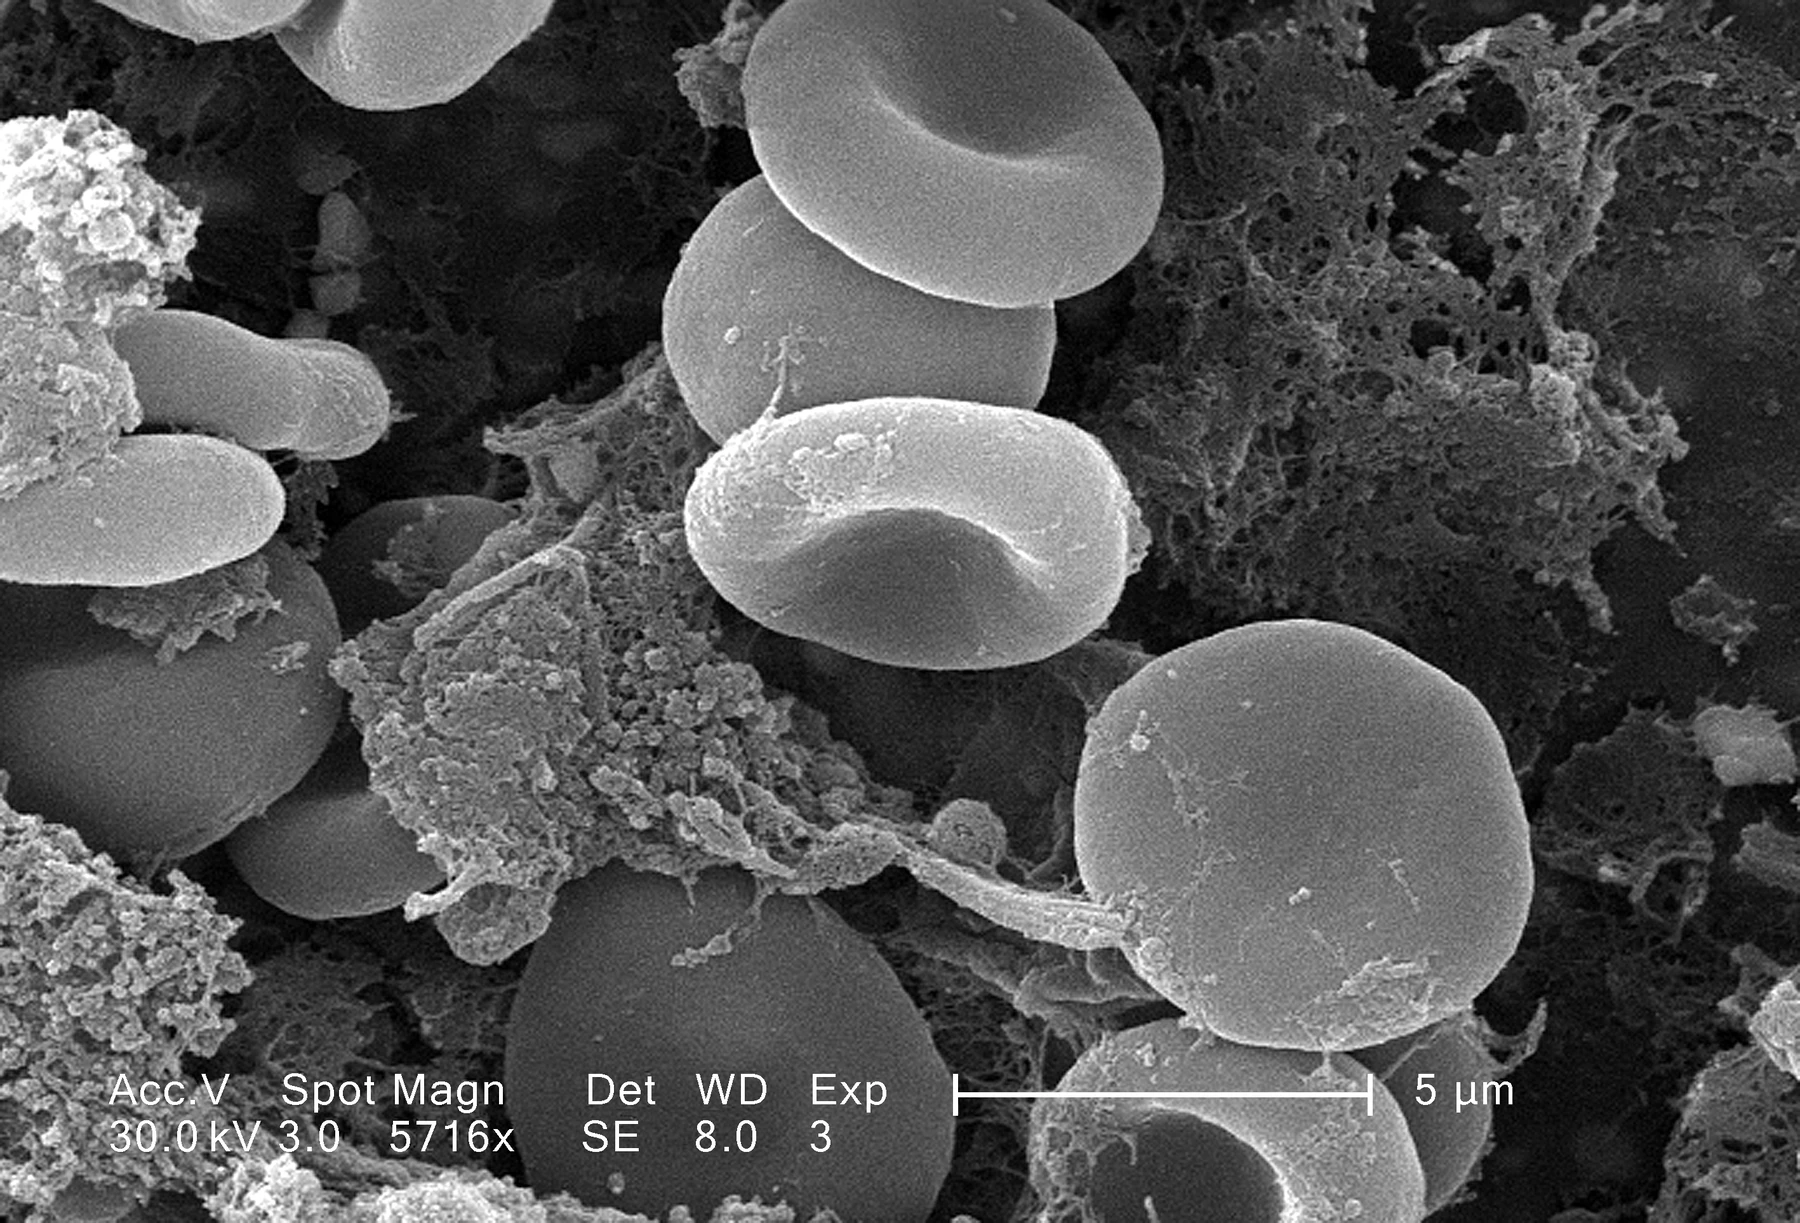
Cropped scanning electron micrograph of red blood cells enmeshed in fibrin on a catheter surface
Cropped SEM reference image of red blood cells in fibrin · CDC / Janice Haney Carr · View the full image and scale bar ↗ · Not Phoenix College data

An image is an
interpretation of data.

Surface shape, molecular labels, optical anisotropy, and crystal structure are different questions. Magnification alone cannot tell you which method to choose.

The methods below are currently available at Phoenix College. Use the comparisons to understand what each signal can reveal, then contact Dr. Ong about specimen suitability, training, and access arrangements.

Phoenix College context

In an April 2024 college profile, Dr. Eddie Ong directed the Center for Microscopy and mentored student SEM work on Sonoran ironwood. The story also described student learning with AFM, FTIR, and XRD. Phoenix College’s academic affairs directory lists Ong as Chair of Physical Sciences.

DR. ONG CONFIRMS

Current methods at Phoenix College

These methods are currently available. Contact Dr. Ong to discuss your specimen, training, and access arrangements.

Read the
surface.

A focused electron beam scans a specimen. Secondary electrons emphasize near-surface detail; backscattered electrons can provide contrast related to material differences.

SEM with energy-dispersive X-ray spectroscopy (EDS) is available at Phoenix College. The characteristic X-rays add elemental evidence to the image; spectra and maps still require careful interpretation.

Specimen

Mount securely. Poorly conductive samples may charge; grounding, a conductive coating, lower beam energy, or a low-vacuum mode may help, depending on the instrument.

Interpretation

Coatings, drying, beam exposure, and charging can change the image or introduce artifacts. Preserve detector, voltage, preparation, and scale information.

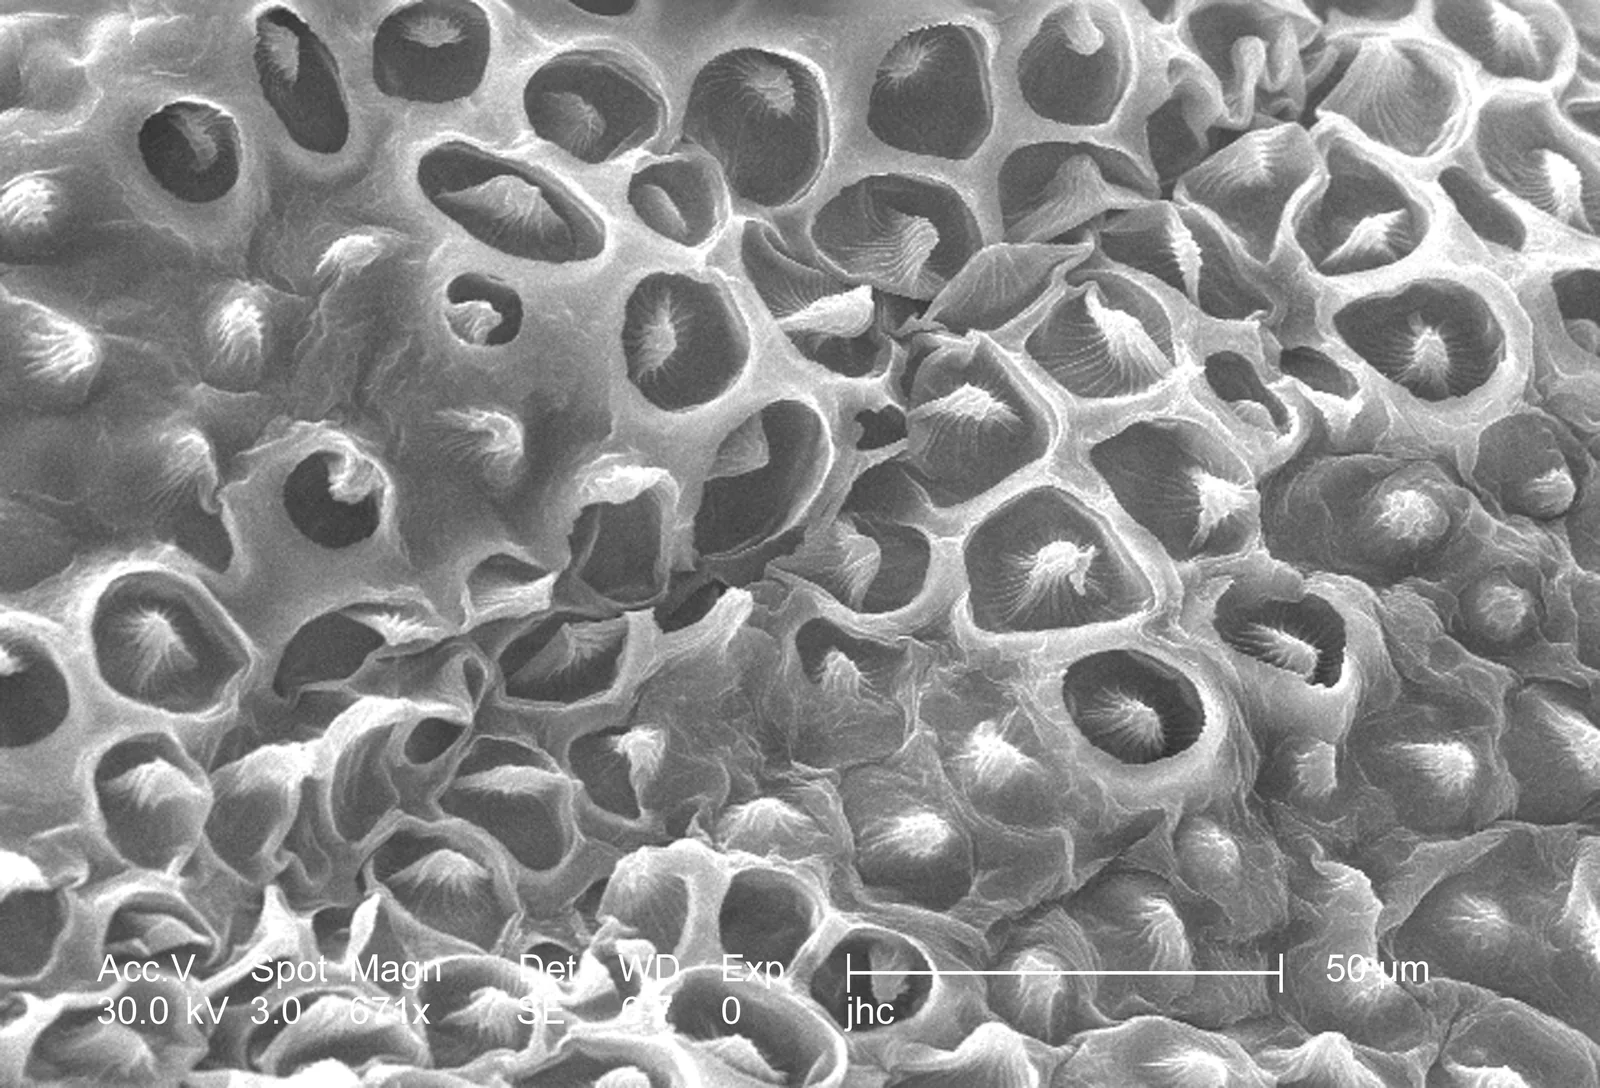
Grayscale scanning electron micrograph of a crimson clover petal surface with an embedded 50 micrometer scale bar
Acquired SEM reference imageCrimson clover petal surface, 671×; source image includes a 50 μm scale bar. Credit: CDC / Janice Haney Carr; Betsy Crane is also listed by CDC. Public domain. View original ↗ This is not a Phoenix College specimen.

From surface form to
elemental clues.

An SEM image and an elemental map answer related, but different, questions. Secondary electrons emphasize near-surface shape. Backscattered-electron contrast can reflect material differences as well as geometry. EDS adds characteristic X-rays that provide evidence about elements in the sampled region.

  1. LocateFind the feature in an electron image, with detector, scale, and preparation recorded.
  2. CompareUse EDS spectra, a line scan, or a map when the question calls for elemental information.
  3. InterpretRead the image and X-ray signal together. X-rays emerge from an interaction volume that can be wider than the beam spot, so a sharp image edge is not automatically a sharp chemical boundary.

At Phoenix College SEM with EDS is available. Contact Dr. Ong to discuss sample preparation, training, and access arrangements.

ONE SCANNED REGIONSCHEMATIC · NOT ACQUIRED DATA
01 / SESurface formNear-surface detail
02 / BSEMaterial contrastDetector-dependent
03 / EDSElemental signalCharacteristic X-rays
The three displays are explanatory graphics, not specimen measurements. EDS map colors are display codes for selected elements; they are not the specimen’s natural colors.

Look through
the specimen.

Transmission electron microscopy (TEM) records electrons passing through an electron-transparent specimen. It can reveal internal ultrastructure rather than only the near-surface form seen in a typical SEM image.

What appears in a TEM image depends on scattering, specimen thickness, preparation, and electron dose. A two-dimensional view can superimpose features at different depths. Any color added after acquisition is a display choice, not the specimen’s natural color.

Specimen

Prepare a very thin section or small particles on a support grid, using a method appropriate to the material. Staining, drying, and freezing can each affect what is preserved.

Interpretation

Record preparation and imaging conditions, look for beam or processing artifacts, and rely on a calibrated scale rather than display magnification.

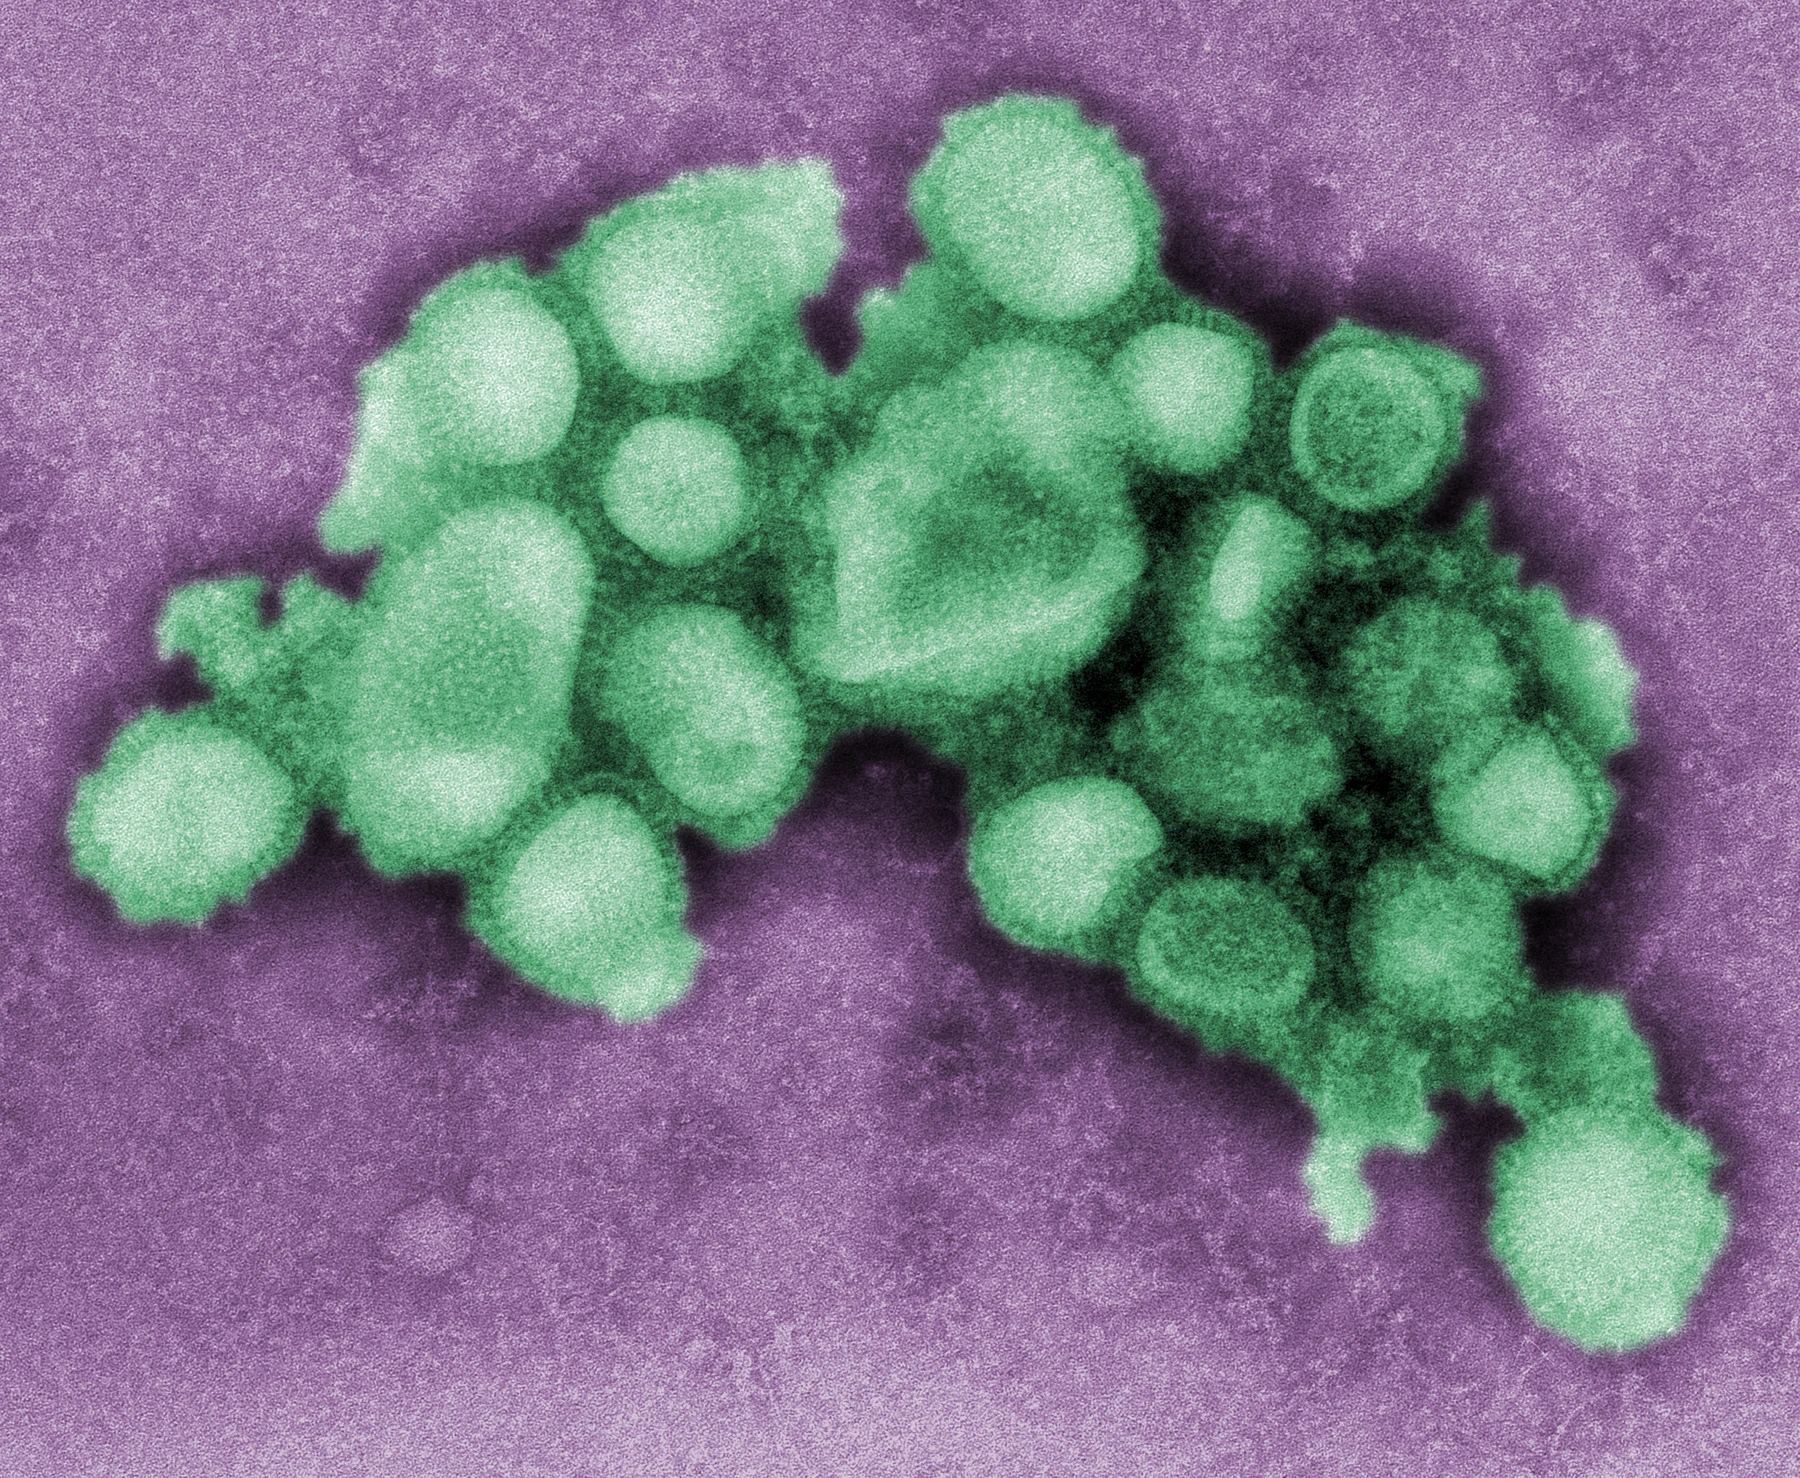
Digitally colorized transmission electron micrograph of 2009 influenza A H1N1 virions
Acquired TEM reference imageVirions from a 2009 pandemic influenza A(H1N1) isolate, digitally colorized by CDC. The PHIL source supplies no scale. Credit: CDC / C. S. Goldsmith and A. Balish. Public domain. View original and credit ↗ This is not a Phoenix College specimen.

Trace the
topography.

Atomic force microscopy measures interactions between a sharp tip and a surface. A cantilever’s response becomes a height map rather than a conventional photograph.

In contact mode, the tip stays against the sample. In tapping mode it touches intermittently, reducing lateral forces that can disturb softer or loosely attached specimens. Specialized modes can map other local properties, but the available modes depend on the instrument and probe.

Specimen

A stable, accessible surface and a suitable probe matter. Choose the scan area and imaging force to suit the material.

Interpretation

The tip has finite width: narrow raised features may appear wider, while trenches may appear narrower. Check probe condition before treating lateral dimensions as exact.

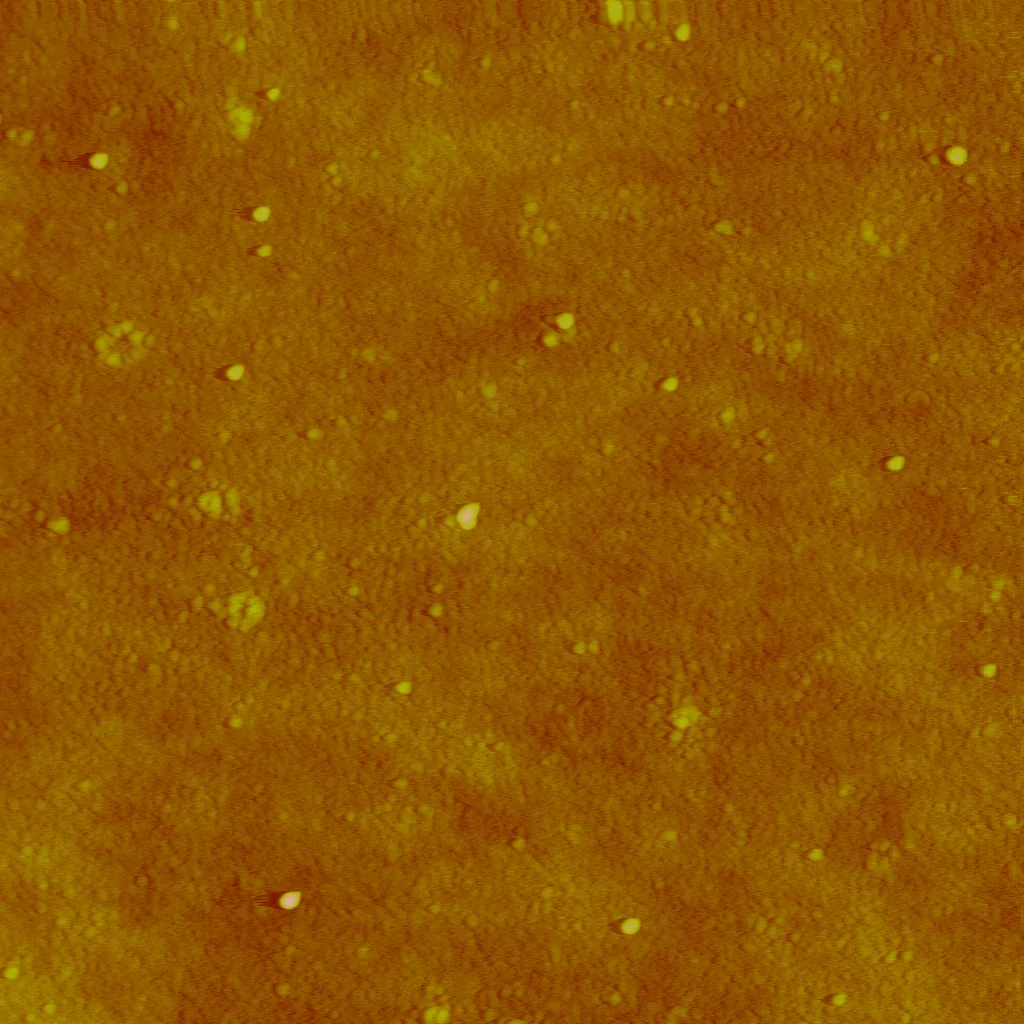
Atomic force microscopy height map of silver nanoparticles; brighter areas represent greater height
Acquired AFM reference imageSilver nanoparticles formed in humic-acid solution. Color encodes height from 0 to 10 nm across a field about 1,700 nm wide. Credit: MacCuspie / NIST. View original ↗ This is not a Phoenix College specimen.

Locate the signal
in depth.

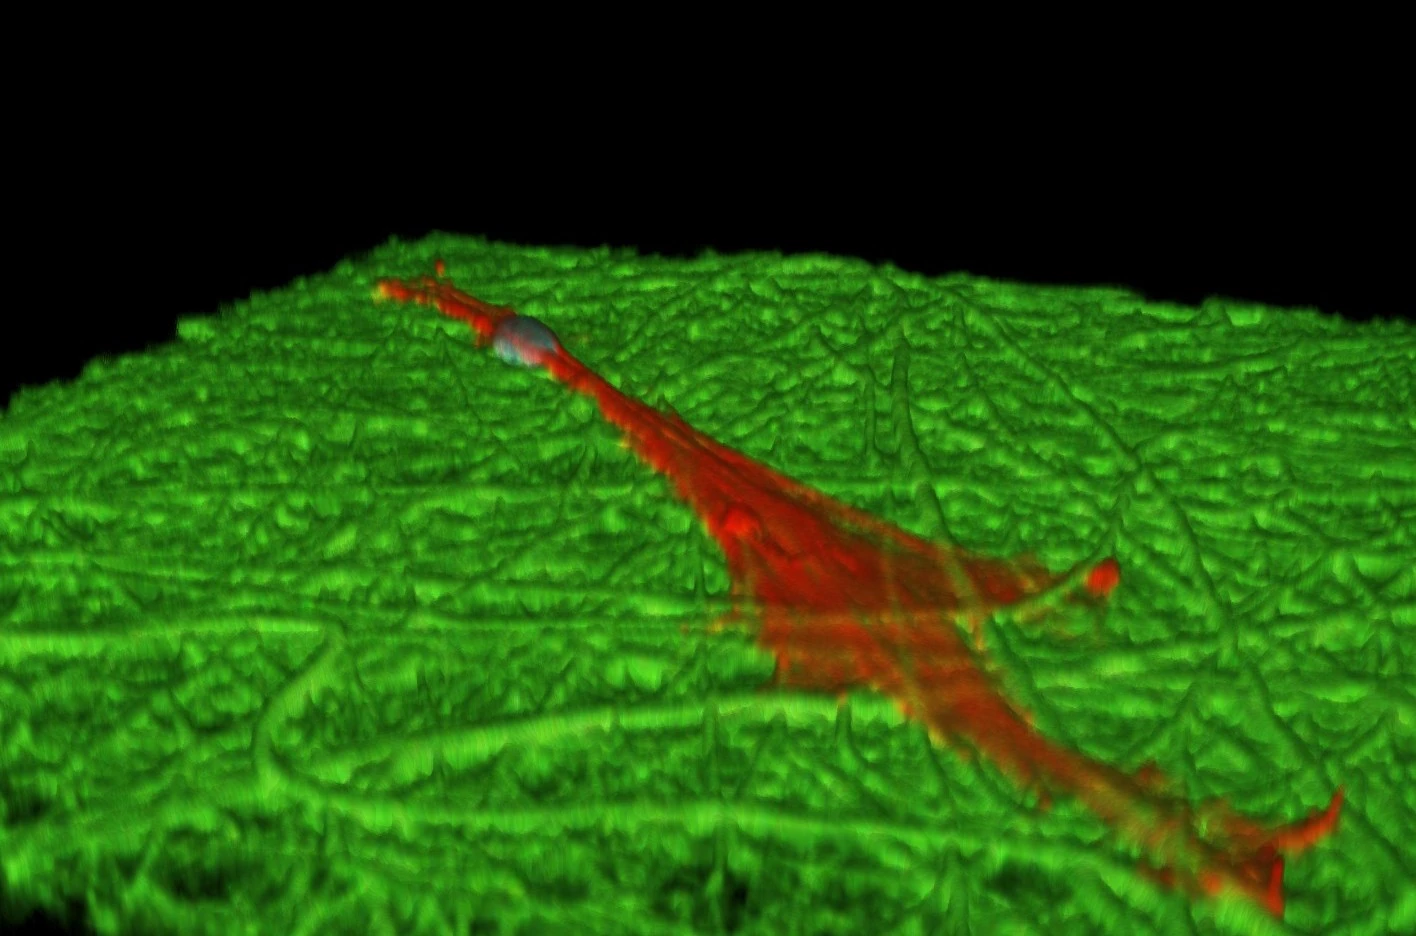
Fluorophores absorb light and emit it at longer wavelengths. In confocal microscopy, a detection pinhole rejects much of the out-of-focus fluorescence.

Serial optical sections can show where labeled structures sit within a thicker specimen. The labeled target, controls, objective, and acquisition settings determine what those bright regions mean.

Specimen

Label selectively and choose mounting conditions that preserve the structure of interest. A thicker sample may need a series of focused planes.

Interpretation

Repeated excitation can bleach fluorophores and damage living specimens. Use the lowest practical illumination and document exposure and image processing.

NIST confocal fluorescence image of a human bone marrow stromal cell with red actin and blue nucleus on green polymer nanofibers
Acquired confocal reference imageA human bone marrow stromal cell on a polymer fiber scaffold. Green shows fluorescent fibers, red actin, and blue the nucleus; NIST reports an image cube of 246 × 246 × 29 µm. Credit: NIST. View original and credit ↗ This is not a Phoenix College specimen.

See optical
direction.

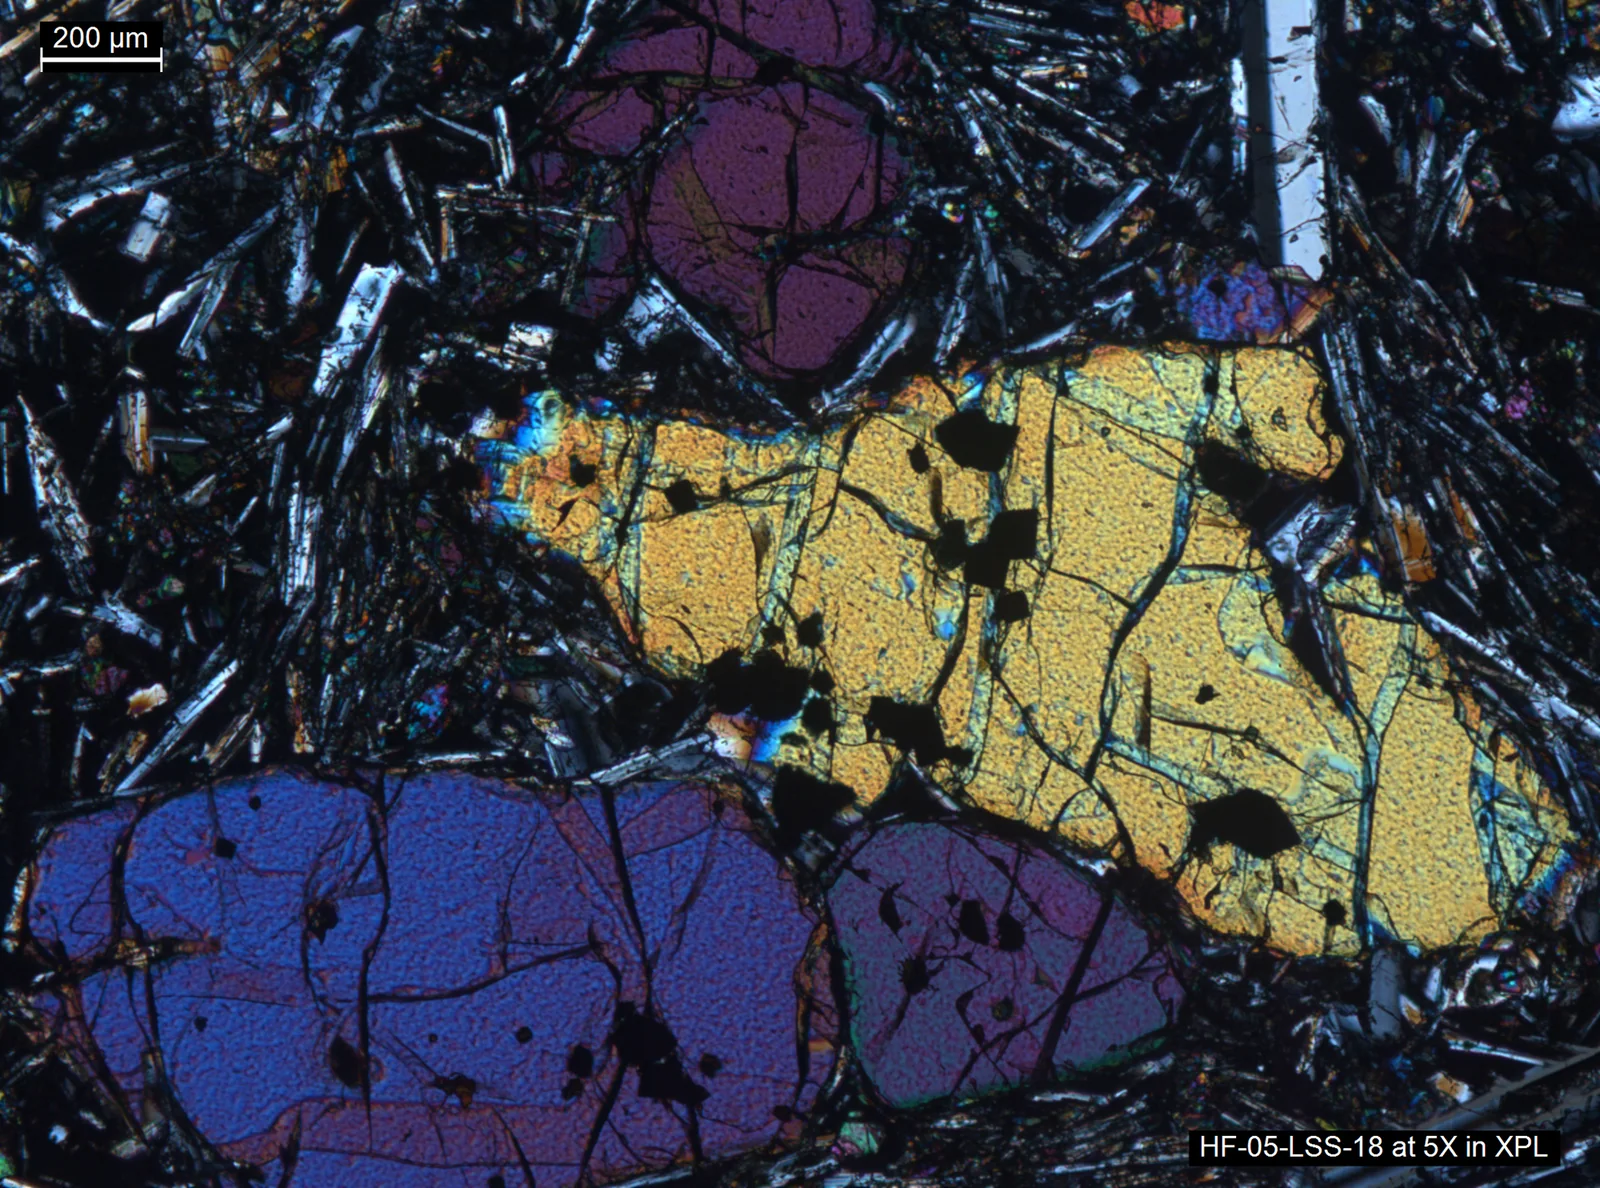
Between crossed polarizers, birefringent material splits light into components that recombine as changes in brightness and interference color.

Rotate the specimen to see how the contrast changes with orientation. This is especially useful for mineral thin sections, but also applies to suitable polymers and other anisotropic materials.

Specimen

For transmitted-light mineral work, prepare a suitably thin section. Uniform thickness makes comparison more meaningful.

Interpretation

Interference color depends on birefringence, thickness, and orientation. Color alone is not a unique mineral identity.

Polarized-light micrograph of a Yellowstone lava thin section showing colorful olivine crystals and an embedded 200 micrometer scale bar
Acquired polarized-light reference imageYellowstone lava thin section; source image includes a 200 μm scale bar. Credit: Brandi Lawler, University of Wyoming / USGS. Public domain. View original ↗ This is not a Phoenix College specimen.

When an image
is not enough.

Microscopy locates and describes features. Spectra and diffraction patterns can answer different questions about the same material.

FTIR

Which molecular groups?

Fourier-transform infrared spectroscopy records which infrared frequencies a sample absorbs. The pattern reflects molecular vibrations and can help identify materials or functional groups.

Choose it for a chemical fingerprint, while remembering that a conventional FTIR spectrum does not show where a feature sits in the image.

Bruker: FTIR fundamentals ↗
XRD

Which crystalline phases?

X-ray diffraction measures patterns produced by ordered atomic planes. Compare those patterns with reference data to identify crystalline phases and investigate structure.

Choose it when composition alone cannot distinguish crystal forms; diffraction does not replace an image of morphology.

NIST: crystalline phase identification ↗

FTIR and XRD are currently available at Phoenix College. Its 2024 student profile describes earlier learning with these methods under Dr. Ong. Contact him about specimen suitability, training, and access arrangements.

Take the next
closer look.

See labeled visual examples, then ask Dr. Ong about a specimen, training, or access arrangements.